Imagine an office portfolio manager in Chicago, staring at a pile of energy reports from multiple buildings. Each city, each building type, and each dataset tells a slightly different story. With local regulations varying and disclosure standards inconsistent, it’s nearly impossible to know which interventions will actually cut costs or reduce carbon.
This scenario reflects a nationwide challenge for the U.S. commercial real estate. Investors, owners, and asset managers are under pressure to improve energy efficiency, reduce carbon emissions, and demonstrate sustainability performance. Yet across the U.S., performance data remains fragmented. Local regulations vary, disclosure standards differ, and comparing assets across regions or portfolios is nearly impossible.
That’s where the new Deepki Index for the U.S. comes in: as a benchmarking framework designed to help real estate professionals make sense of their energy and carbon performance—region by region, asset by asset. Until now, there has been no consistent, benchmark that is based on real, audit-ready consumption data to measure progress across markets and asset types. That changes with the launch of the U.S. Deepki Index. After four years of establishing itself as Europe’s industry standard, the 2025 Deepki Index now includes office and logistics assets across six U.S. regions: California, Texas, Florida, New York City, the Midwest, and the Northeast. For the first time, investors, owners, and sustainability teams have a clear, data-driven framework to measure progress, identify opportunities, and make strategic decisions.
What is the Deepki Index?
To bring order to this fragmented data landscape, the Deepki index provides real, market-based benchmarks for energy use and carbon emissions in commercial real estate. It highlights the average, top 30%, and top 15% of performance across building typologies, helping the industry measure progress and compare results against resources like CBECS (Commercial Buildings Energy Consumption Survey).
Developed with leading industry bodies, the index is built on verified, audit-ready data rather than estimates. It provides real estate stakeholders with a reliable reference point that brings clarity, consistency, and comparability to a fragmented market, supporting the transition toward lower-carbon real estate.
“The Deepki Index is much more than just a tool: it is the benchmark that the market needs to transform its ambitions into concrete actions.”
Sandrine Fauconnet, Senior Associate, ESG & Sustainability Stoneweg
Why U.S. teams need a benchmark
In many parts of the U.S., deregulation limits access to reliable energy and emissions data, even as states and cities push ambitious building performance standards. Without a trusted reference point, asset managers are left to interpret raw data without context, making it hard to identify priorities or evaluate the impact of interventions.
The Deepki Index fills this gap by providing a nationally consistent benchmark grounded in actual consumption data. Teams gain a realistic view of where their buildings stand and where to focus efforts for the greatest return on energy, carbon, and cost reductions.
How the benchmark works
The U.S. Deepki Index is based on actual energy consumption data collected from office and logistics assets across multiple regions. It applies robust quality filters to ensure comparability, accounting for factors such as year-to-year variation, climate sensitivity, and data completeness.
The Index is based on energy consumption data monitored through Deepki’s sustainability SaaS solution. It currently supports $4 trillion in real estate AUM across more than 80 countries. This initiative is the only one based on actual data and an editor-verified methodology. It allows us to maintain full control over the data collected and processed.
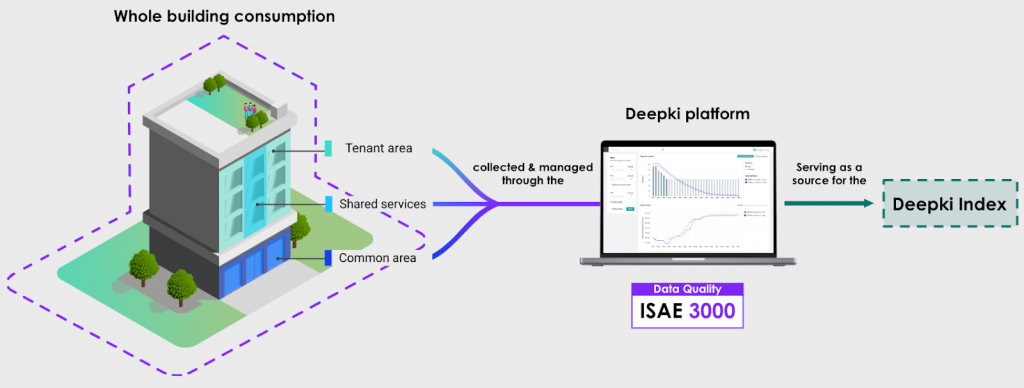
By collecting real energy consumption data at the meter level, the exact energy mix of each building can be known, enabling us to produce very precise conversions in primary energy and CO2eq emissions. Internationally recognized emission factors (e.g. IEA) and national primary energy factors are used.
It’s important to note how the Deepki Index methodology differs from the commonly used ENERGY STAR Portfolio Manager (ESPM) benchmarking and scoring. While ESPM provides a normalized score based on survey data (CBECS) and static asset characteristics, the Deepki Index is built directly on aggregated, verified, audit-ready, meter-level consumption data. This focus on real consumption, rather than estimated or modeled performance, provides a more granular and actionable picture of current energy and carbon performance. The publicly launched Deepki Index serves as a free preview of the powerful, detailed benchmarking capabilities available within the full Deepki SaaS platform, which offers deeper, customized analysis.
Regional insights highlight opportunities
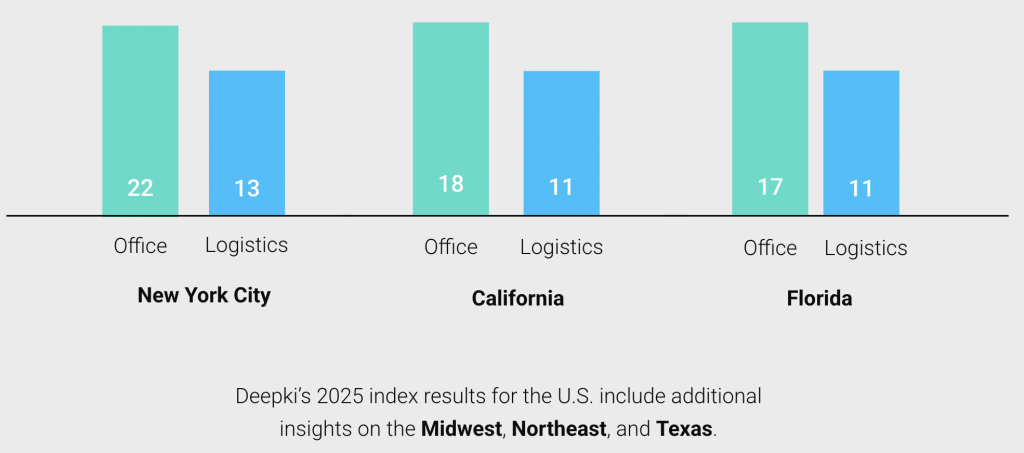
With verified data in hand, what does performance actually look like across the U.S.? The index reveals clear regional differences. In colder parts of the Industrial Golden Triangle (including Chicago, Indianapolis, and Columbus), office buildings show 23% higher energy intensity than the national average. These regions are critical economic hubs, meaning efficiency improvements here can deliver significant environmental and financial impact.
Meanwhile, warmer or less energy-intensive regions such as Florida and Texas show lower average consumption, but performance still varies widely by building age, design, and management practices. Understanding these differences helps portfolio managers focus investments where they matter most. Meanwhile, occupancy patterns also affect energy use: New York City offices are back to over 90% occupancy, compared with around 50% in Houston and San Francisco, further explaining regional discrepancies.
Understanding these differences allows portfolio managers to focus resources strategically, targeting interventions where they will have the greatest impact.
From benchmarking to action
A benchmark is only useful if it informs decisions. The Deepki Index enables asset managers to:
- Identify underperforming buildings for operational improvements or capital upgrades
- Prioritize interventions based on ROI and energy savings potential
- Align sustainability initiatives with regulatory requirements and investor expectations
Combined with tools like Virtual Retrofits and climate resilience, the Index allows teams to model investments, estimate savings, and plan upgrades with confidence.
Looking ahead
The launch of the Deepki Index in the U.S. represents a step toward greater transparency, comparability, and accountability in commercial real estate. For asset managers and sustainability teams, it provides the clarity they need to set informed goals, allocate capital effectively, and demonstrate progress to stakeholders.
Flora Adamian, Senior Analyst, Sustainability at Bellwether, emphasizes:
“Clear, data-driven benchmarks are important for advancing sustainability in real estate. Tools like the Deepki Index can help bring greater transparency and alignment across the industry.”
With the Deepki Index, U.S. commercial real estate now has a gold standard to measure sustainability, identify opportunities, and safeguard long-term value.

WEBINAR REPLAY
Want to see how your portfolio compares?
Get insights from the 2025 Deepki Index in Deepki’s end-of-year Product Release webinar, and discover data-driven energy consumption and emissions benchmarks across European and U.S. commercial real estate.