Sustainability reporting is evolving fast. Auditors, investors, and stakeholders expect transparent, accurate, and traceable data and managing it across hundreds of buildings can quickly become overwhelming. Spreadsheets, emails, and fragmented datasets slow down your teams and leave room for errors.
This quarter, Deepki introduces a suite of updates designed to simplify reporting, improve data quality, and provide a complete view of your carbon footprint all from a single platform. From the new Reporting Center to the updated Supervision Board, enhanced Benchmark Widget, and expanded carbon tracking features, these tools help teams act with confidence, save time, and demonstrate measurable impact.
Centralize audit-ready reporting
Imagine preparing for an audit without the usual chaos: no chasing missing invoices, no cross checking dozens of Excel files, no late-night validation work.
Ensuring data reliability and audit readiness has always been a challenge for sustainability and asset management teams. With 67% of investors expecting sustainability reports to undergo full audits, the real estate market is under growing pressure to professionalize reporting.
Deepki’s new Reporting Center provides a centralized, structured workflow to prepare, validate, and manage sustainability data. From framework and scope selection to asset selection, data snapshotting, internal controls, audit-pack generation, and final report formatting, Deepki’s platform handles everything in one place.
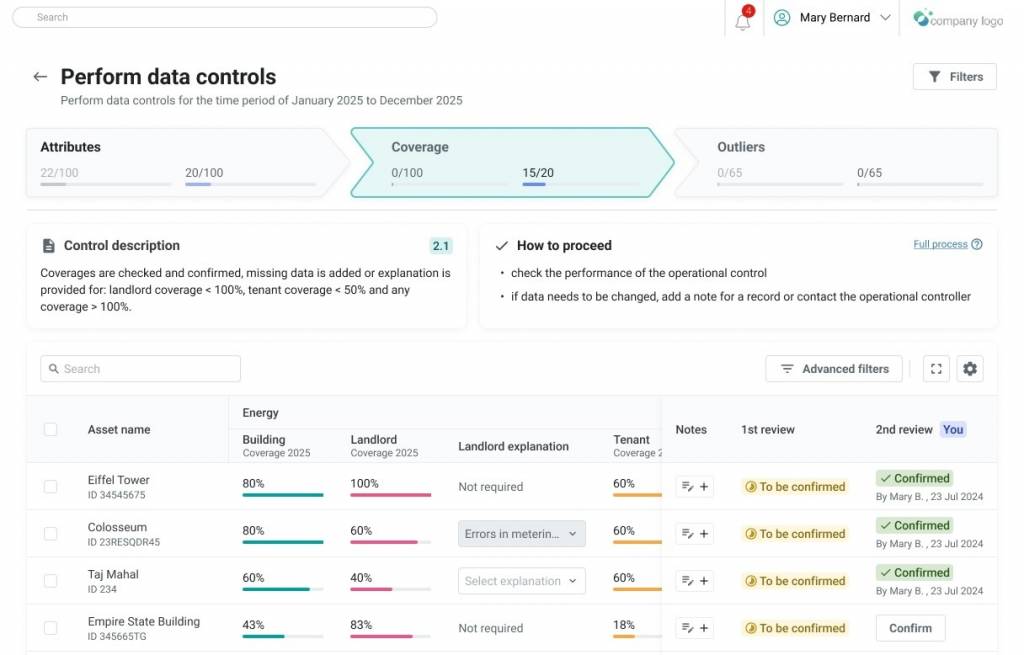
Built-in verification checks automatically flag anomalies, coverage gaps, outliers, and year-on-year variations. The four-eyes principle ensures that each validation is reviewed collaboratively, with comments, explanations, and evidence captured. All logs are time-stamped and consolidated within a downloadable audit pack, giving auditors full transparency and significantly reducing review time.
The result? Less time spent on manual tasks, fewer errors, and more confidence that your reporting is accurate and defensible. All of this aims to enable smoother audit phases for sustainability managers, controllers, and auditors alike.
Gain full control over your data quality
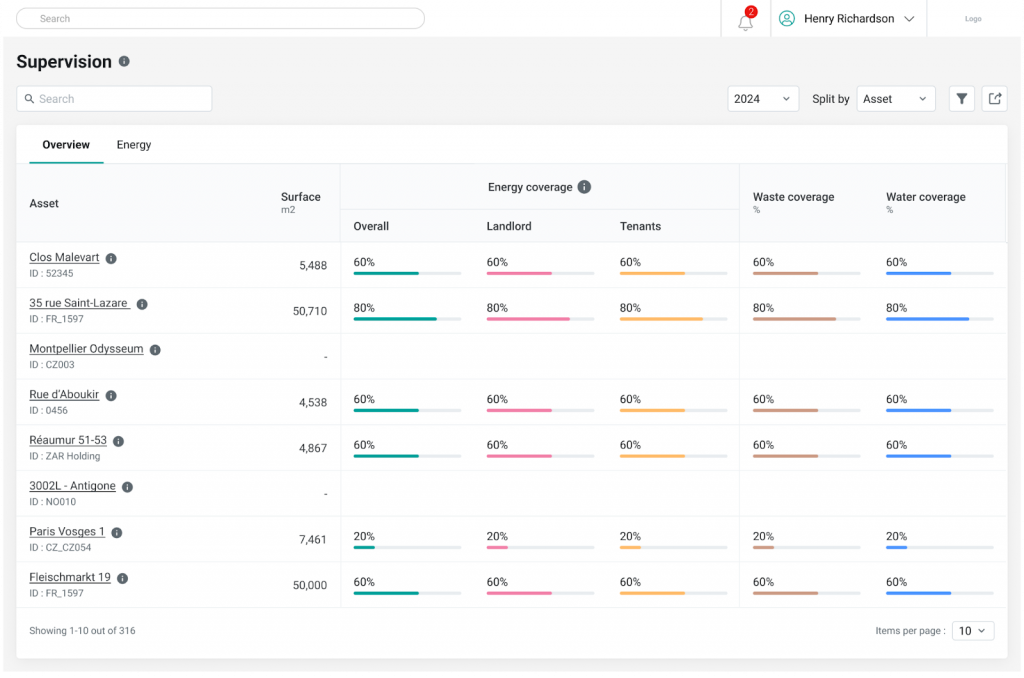
Having accurate data is crucial, but spotting errors and gaps across a large portfolio can feel like searching for a needle in a haystack. Stop guessing why your data coverage isn’t reaching 100%. The new Supervision Board gives you full visibility into your data coverage at the asset level, so you can see exactly where and why data gaps occur.
With this new feature, teams gain clear building-level visibility of their data quality. Instead of only visualizing gaps, teams can act immediately: reconnect missing meters, investigate anomalies, and improve overall data completeness at the asset level.
Asset and property managers can correct data issues faster and build a more reliable foundation for performance tracking, reporting, and strategic decisions.
Turning better data into better outcomes
Contextualize insights at a glance
Once you have accurate and reliable data, teams need contextualized insights to make informed decisions. Interpreting performance data has historically been challenging. Sustainability managers often struggle to understand whether a gap is critical or how estimated values affect overall performance.
The enhanced Benchmark Widget addresses this by providing contextualized insights with simplified access to documentation. A new breakdown view clearly shows the share of collected versus estimated data, making it easy to assess portfolio performance at a glance. Teams can now quickly answer questions like:
- Which assets need attention?
- How complete is the data?
- What is driving observed performance differences?
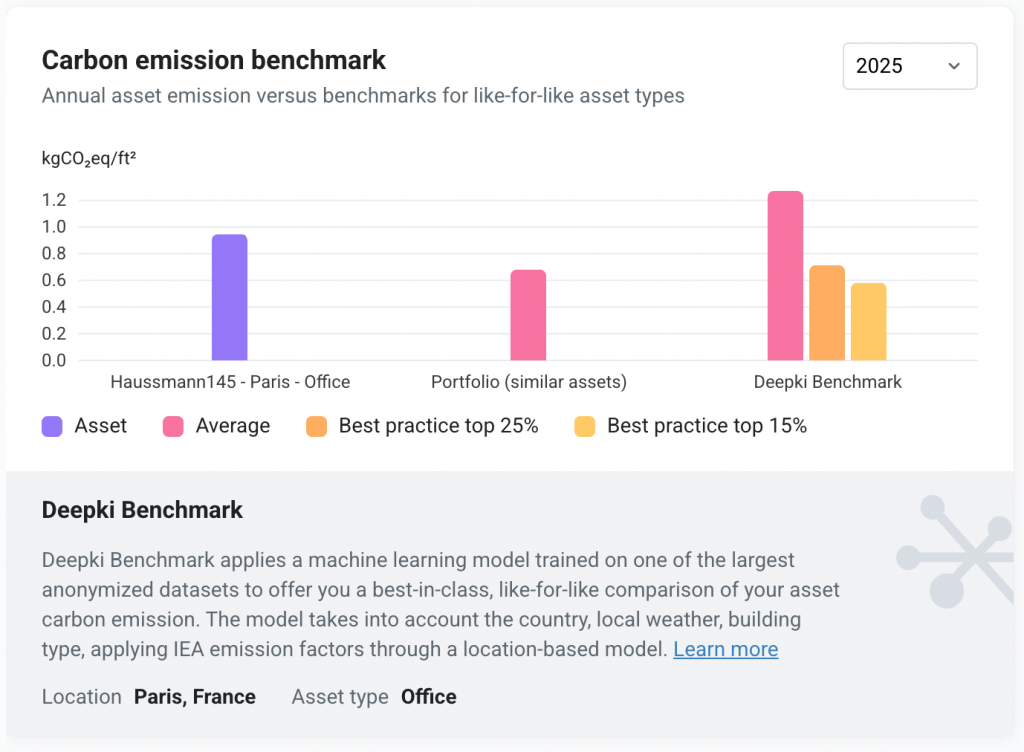
By providing clarity and transparency, the Benchmark Widget enables smarter decisions without getting bogged down in spreadsheets or complex calculations.
Capture renewable energy impact
Decarbonization strategies rely increasingly on on-site renewable energy, but accurately reflecting its contribution has been tricky. Now, avoided emissions from on-site green energy production are automatically integrated into carbon pathways.
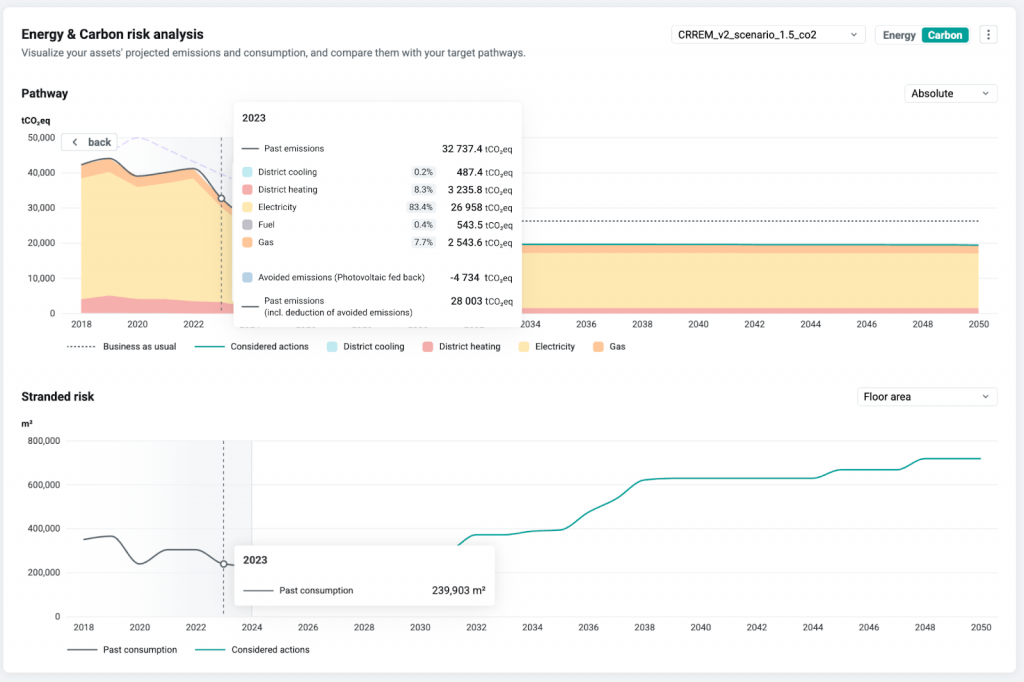
This ensures that renewable energy is no longer just a checkbox but a measurable lever for reducing emissions. Sustainability and asset management teams can now plan retrofit actions and track portfolio carbon trajectories with greater precision, aligning with CRREM methodology and investor expectations.
Measure carbon emissions with greater accuracy
Energy is not the only contributor to a building’s carbon footprint. Water and waste have historically been overlooked, leading to partial or inconsistent reporting. Deepki now lets teams calculate CO₂ emissions from water and waste directly in the platform. Methodologies can be adapted by country, utility, or fluid for greater flexibility.

This provides a complete and accurate picture of your portfolio’s footprint enabling better compliance, reporting, and decision making. You can now measure, monitor, and optimize every element, leaving no blind spots in your sustainability strategy.

WEBINAR REPLAY
Want to see how your portfolio compares?
Explore these new features in our end-of-year Product Release. Plus, get insights from the 2025 Deepki Index, providing a data-driven view of energy consumption and emissions benchmarks across European and U.S. commercial real estate.