What if your sales staff arrived three hours before the store opened every morning? You would see it as an absurd waste of resources, and you’d be right! And yet you squander resources just as needlessly every day, by leaving appliances and lights on outside of business hours. How can you eliminate this kind of waste? Right this way..
Determining whether energy consumption is properly controlled
Let’s look at a chain of 826 stores in France. It makes sense that more energy would be used during opening hours (on average, 9 a.m.–7 p.m.) than when stores are closed.
But how can you know for sure? First of all, you need to consider each store’s opening hours: some open earlier, some close later, some operate on Sundays, etc.
Next, you need to analyze the actual load curves for each store in relation to opening hours: does the energy consumption curve show a clear difference between opening and closing hours? In a store where consumption is controlled, the load curve will be constant during the day and drop sharply at closing time, when equipment goes into standby mode.
Using algorithms to zero in on anomalies
Data reconciliation can be time-consuming work, especially for a chain of several hundred stores. Fortunately, algorithms are now able to detect anomalies automatically, sometimes revealing massive excess energy consumption…like equipment switching on four hours before stores open!
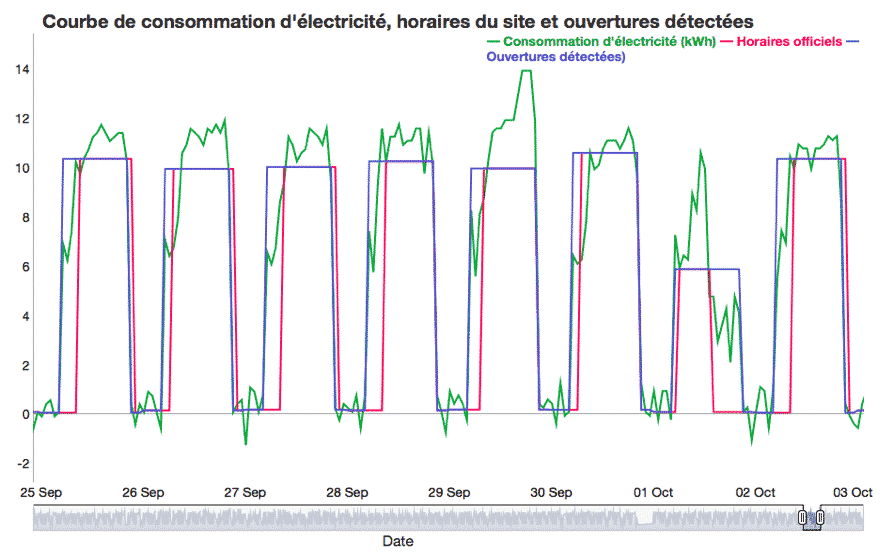
The graph below highlights problematic equipment activity in one store:
- The red curve indicates official opening and closing times (the high and low plateaux, respectively).
- The green curve traces actual electricity consumption, whether the store is open or closed.
- The blue curve shows where consumption begins to exceed the night-time level, ex: when staff arrives before opening time or when equipment is triggered.
Electricity consumption curve, site opening hours and detected activity

The (almost) systematic discrepancy between official opening and closing times (red curve) on the one hand and detected periods of activity (blue curve) on the other points to energy consumption patterns that are far from optimal. Case in point: even though the store doesn’t officially open until 10 a.m. on September 27 (segment 3 on the graph), its equipment starts up as early as 5 a.m. And on Sunday, October 1 (segment 7) after closing, it takes all afternoon for the store to return to a normal consumption level.
Spotting significant energy waste in the retail sector
It’s only normal for a store to remain active outside official hours each day – for cleaning, restocking, inventory, etc. But even allowing for a daily average of two hours for these activities, and looking at the entire chain over one year, more than 100,000 hours were detected where store equipment ran for no apparent reason.
This represents five and a half days of unnecessary consumption per store each year, or €54,000 of pure waste across the network!
Algorithms can detect off-hours equipment activity and alert you to anomalies, enabling you to prevent needless waste. They can highlight problems with equipment control, and help you prioritize stores based on excess consumption and potential energy savings. With algorithms on your side, energy efficiency is not far behind!


