As the demand for sustainability in real estate continues to grow, industry stakeholders are increasingly looking for reliable ways to measure and track environmental performance. In this evolving landscape, transparency and accountability are critical. That’s where the ESG Index comes in.
First publicly available tracker for environmental performance in European real estate, the ESG Index released its third edition in November 2024. Recently audited by a Big Four firm, this milestone marks a significant step forward, following months of collaboration with external auditors and Deepki’s internal scientific committee to ensure transparency on the reliability of the methodology and the results.
In this blog, we’ll explore key findings from the 3rd edition of the ESG Index, highlighting trends in energy performance across Europe’s real estate sector. From sector insights to data-driven strategies for achieving net-zero, discover how this tool is helping investors and decision-makers.
A data-driven approach to ESG
To address the complexities of measuring real estate performance, the ESG Index relies on a robust foundation: real consumption data. The ESG Index leverages this data from Deepki’s ESG management platform to track energy use and carbon emissions across Europe, offering unmatched data quality and insights into real estate performance with a data sample of 30,000 assets. Published on an annual basis, each yearly result is based on the previous year’s consumption data. For example, the 2024 results are based on 2023 consumption data from the buildings part of our representative sample.
Read more: An ESG index for the real estate industry that arrives just in time
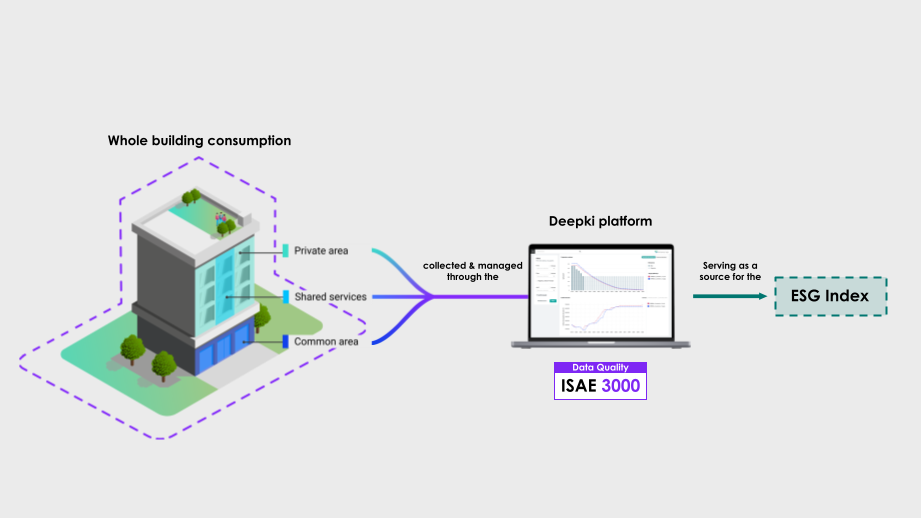
Deepki has developed automated data collection capabilities at the meter level over the past 10 years, deploying them globally to capture whole-building consumption, including private areas. Its extensive and diverse customer base—including investors and occupiers —provides a rich source of data, with control over all building consumption, ensuring comprehensive coverage across all property typologies.
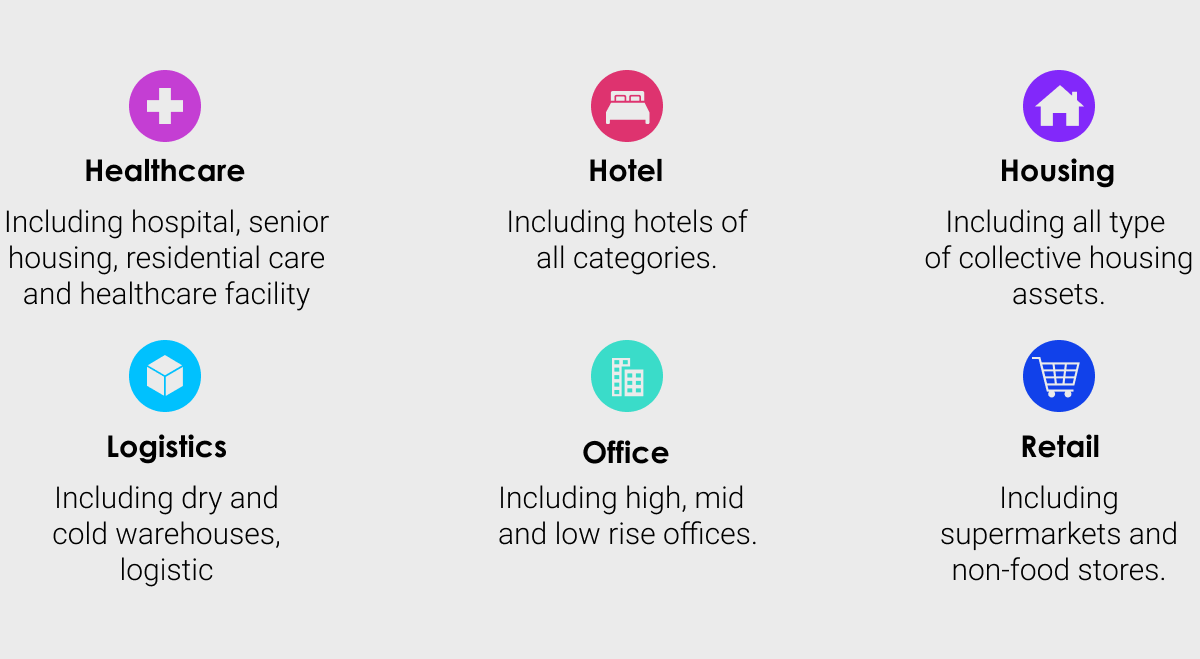
The typologies result from aggregating 60+ subtypes tracked by Deepki on its platform. These various and complex typologies are then aggregated – respecting the proportions observed in national building stocks – into the following:
With end-to-end ownership over the data, from the data collection at the meter level to the computation of the results, Deepki, therefore, can offer unparalleled control over the data processing, ensuring unmatched data quality and empowering decision-makers with accurate insights into energy performance across European real estate.
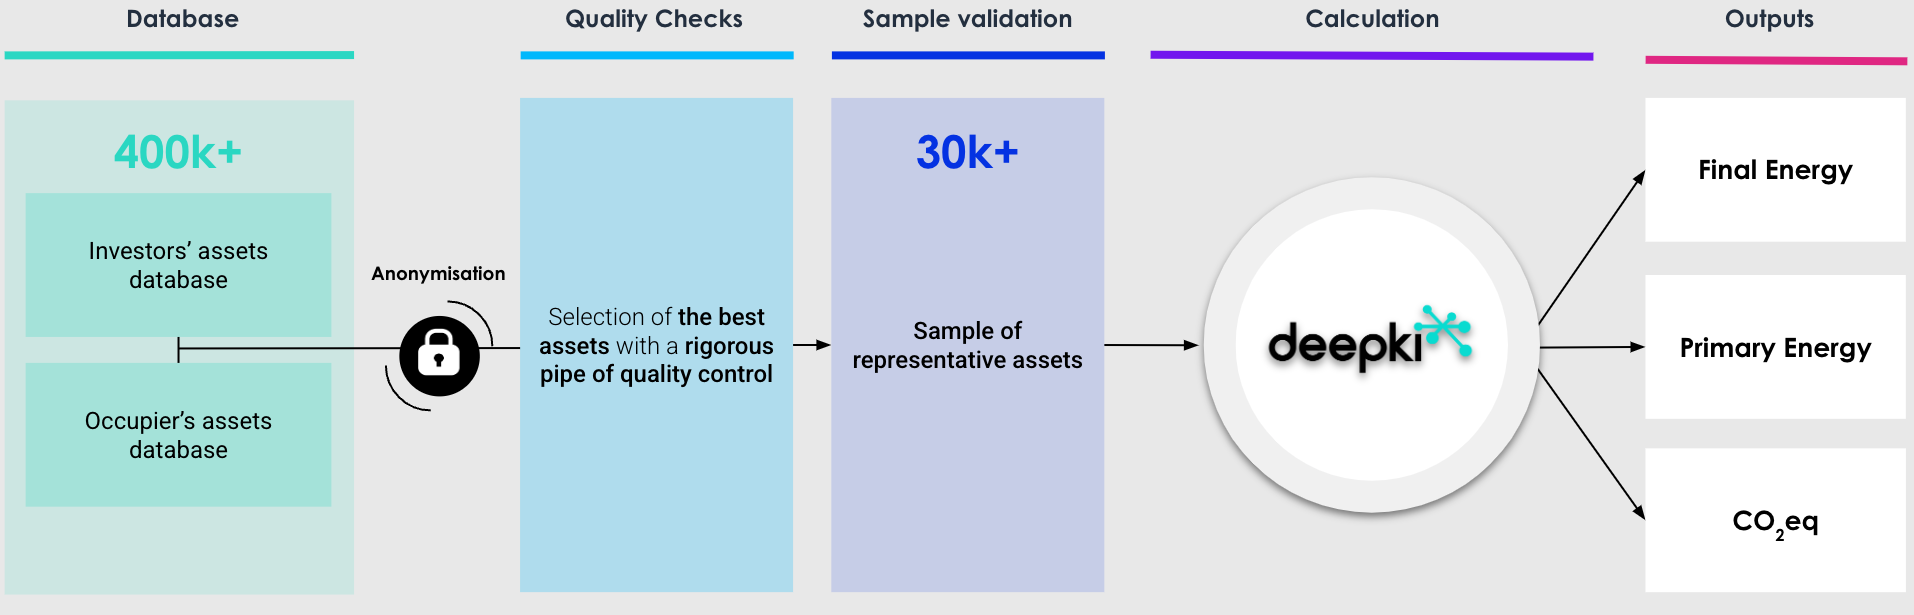
Graphic 2: The ESG Index calculation pipeline – detailing the data collection, processing, and quality control steps.
For a detailed overview of the methodology, explore the blog Behind the Scenes of the ESG Index.
The third publication’s results
The 3rd publication of the ESG Index reveals progress in Europe’s real estate energy performance. Most sectors – logistics, offices, housing, and healthcare – reduced energy consumption between 3% and 13% year-on-year (as seen in Graphic 3 below). Rising energy prices across Europe in recent years have been a significant driver of this trend. However, the market still needs to implement large-scale CAPEX plans to adapt assets to climate change effects and mitigate them.
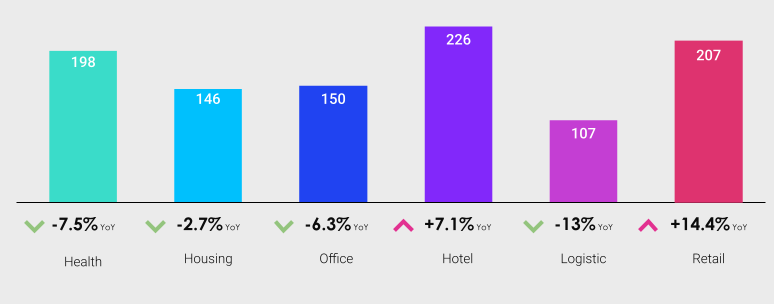
(2022 vs. 2023).
Graphic 3 highlights a positive overall decline in energy consumption across European real estate but identifies key outliers, such as the hotel sector. These exceptions show the importance of understanding sector-specific challenges to develop effective sustainability strategies.
Sectoral Insights: trends and challenges
Hotels buck the trend: why energy use in hospitality is surging
Average hotel energy consumption across Europe has surged by 24% since 2021. This trend may be influenced by factors such as post-pandemic recovery, increased online bookings, flexible reservations, and the return of long-haul flights from Asia Pacific, which boosted occupancy rates by 8% in Europe in 2023 (+5% in Spain), as seen in Graphic 4 below. However, this rise underscores the importance of addressing not just building renovations but also the way energy is used.
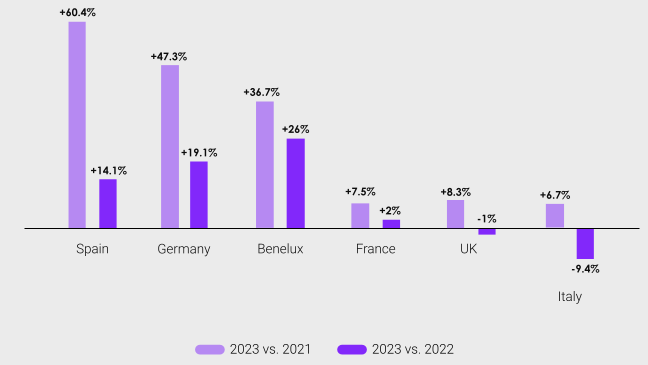
The ongoing growth of the hotel industry serves as a reminder that both external market forces and operational needs influence energy consumption. Achieving carbon neutrality requires both improving buildings’ energy efficiency and resilience to climate change, as well as changing how we use them through our behaviors and habits.
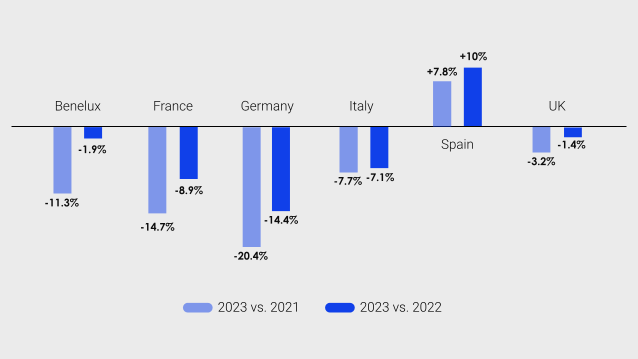
Energy use in offices declines
Energy consumption in office buildings decreased year-on-year, with Germany (-14.3%) and France (-8.9%) seeing the most significant reductions. This trend likely stems from the ongoing challenges in the commercial office market. However, it also signals a crucial opportunity for decision-makers and asset managers: investing in refurbishments could improve energy efficiency and enhance the long-term value of their assets by increasing their attractiveness.
Read more: The impact of ESG performance on real estate asset value
Healthcare: a strong performer
Energy use fell by 7.48%, with Spain (-8.9%) and Italy (-6.2%) performing exceptionally well. Healthcare typologies illustrate the importance of considering the use of buildings in terms of their habitability by 2050, with a radically altered climate and significant climatic risks. We can expect that today, healthcare asset operators do not have easy-to-use levers for reducing building consumption through use, given the nature of their occupants. The primary way to improve the performance of this type of building is through ambitious renovation plans that also aim to protect their occupants from climate risks by 2050.
Retail: complex variations
Retail real estate saw notable year-on-year variations, likely due to the diverse nature of the assets involved. While the distribution of these assets within the sample remains stable, the factors driving changes are varied, making detailed analysis more complex. Focusing on long-term trends rather than annual fluctuations may be more insightful to understanding asset performance.
In 2023, many studies reported a decline in vacancy rates across retail real estate, driven by international travel recovery, which helped re-dynamize prime high-street retail. This trend was particularly strong in Southern Europe, with Spain leading the way. The country experienced notable sales growth, with vacancy rates dropping below pre-pandemic levels and a corresponding increase in energy consumption. Spanish shopping centers also recorded one of the highest increases in footfall—a key metric tracking the number of visitors—among European countries.
What else can we observe?
Over the past three years, most European real estate sectors have seen energy reductions influenced by the energy crisis, rising costs, and reduced gas supply, though hotels and retail remain outliers. This trend serves as a cautionary signal for decision-makers and asset managers: the decline in energy usage is often a result of necessity rather than intentional measures. While the trend is moving in the right direction, achieving net-zero emissions will require planned and substantial refurbishment initiatives alongside changes in energy usage behaviors. The EU underscores the importance of this, noting that the estimated funding gap for energy efficiency investments in the EU over the next decade is EUR 185 billion per year.
In a broader context, the European Commission recently reported that total net greenhouse gas (GHG) emissions across the EU fell by 8.3% in 2023, marking one of the most significant declines in decades.
This accelerated decrease in GHG emissions is an encouraging sign that Europe is making significant strides toward its climate goals. Reducing GHG emissions is vital to slow the rate of global warming and mitigate its impact on the environment and human health.
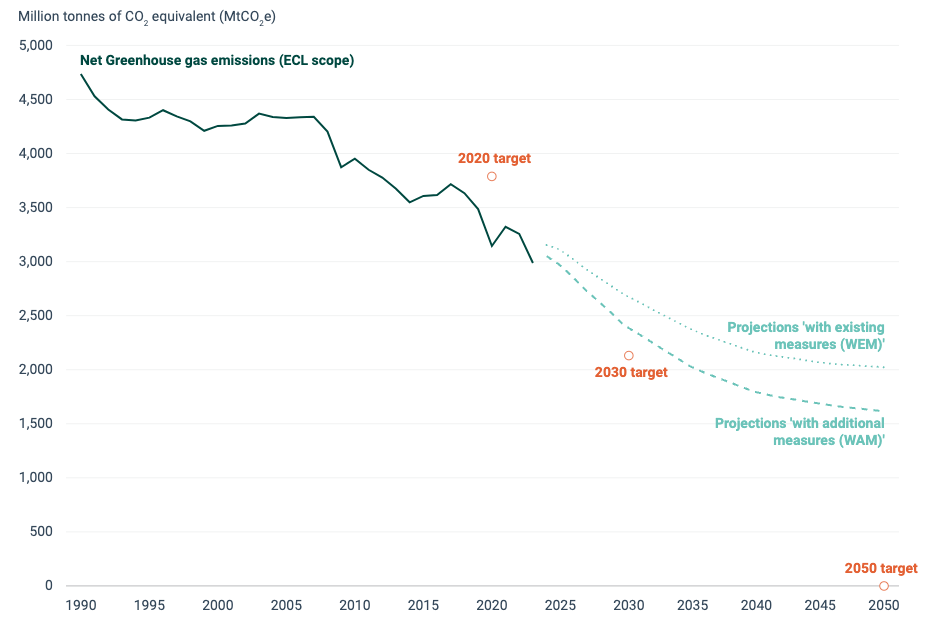
(source: European Environment Agency)
Looking specifically at buildings, GHG emissions in Europe have seen a substantial downward trend—down 31% from 2001 to 2021. This decline is expected to continue through 2030, thanks to key regulations like the EU Green Deal and the Renovation Wave Initiative, which are propelling further reductions in emissions.
Energy trends across Europe: country-level insights from the ESG index
With buildings contributing approximately 40% of global CO₂ emissions, the ESG Index enables tracking building stock’s annual progress toward net-zero goals at a national level and identifying the actions required to meet these targets. As an open-access resource, the ESG Index supports the real estate market, policymakers, and research institutions in redirecting investments toward net-zero initiatives.
This third publication provides an overview of the annual consumption and emissions of the European building stock and a view of how these will evolve in a highly sensitive context (energy crisis, increasing effects of climate change, and increased regulation of Europeans in the building renovation sector).
The UK faces significant challenges, with the highest energy consumption per square meter among the analyzed European countries. Despite this, energy usage across most sectors decreased last year, likely due to rising energy costs and stricter regulations. However, the country’s real estate sector remains one of the largest CO₂ emitters, with buildings averaging 23.7 kgCO₂eq/m² for logistics and 56.7 kgCO₂eq/m² for hotels. This underscores the need for more targeted energy reduction strategies and investment in a cleaner energy mix.
This should be read in light of the 2023 Progress Report to Parliament from the Climate Change Committee (CCC) that alerted decision-makers that the UK might be off track from its climate objectives. While the CCC also emphasized that investing in cleaner energy would benefit the country and tenants, these challenges highlight the need for more decisive action.
One sector showing promise, however, is healthcare, which achieved a 20% reduction in energy use. The easing of COVID-19 pressures has played a role in this progress, as has the growing focus on Environmental, Social, and Governance (ESG) factors within the sector, particularly in Senior Housing. Despite challenges like social unrest and frequent strikes in 2023, which also helped reduce consumption, the healthcare sector has shown its potential for energy efficiency improvements.
France leads in energy efficiency, with a 5% drop in multi-family housing energy use year-on-year and a 12% reduction in retail for two years in a row. This decline can be attributed to rising energy prices and a slight decrease in daily occupancy as the country navigated post-pandemic recovery. France’s building stock is among Europe’s lowest CO₂ emitters, with logistics averaging 7.6 kgCO₂eq/m² and healthcare at 24.1 kgCO₂eq/m², reflecting the nation’s greater electrification of the building stock coupled with a decarbonised electricity mix.
Retail activity declined in 2023 due to rising prices and social unrest, leading to store closures and reduced electricity consumption, as reported by RTE France. However, the Champs-Élysées stood out from this trend, with strong demand for retail space. This was driven by flagship stores adopting cutting-edge, energy-intensive technologies.
Germany’s real estate sector has significantly improved its energy efficiency, with a 14% reduction in office energy consumption. Compared with its British neighbor, Germany’s real estate stock performs better on average. While differences in climate may explain some of the discrepancies, they do not fully explain the gap.
Despite this progress, Germany still faces a challenge in reducing its CO₂ emissions. Buildings in the country average between 29.1 kgCO₂eq/m² for housing and 66 kgCO₂eq/m² for hotels, primarily due to the country’s shift from nuclear to fossil fuel-based energy sources. To meet long-term sustainability goals, Germany must continue its strategic transition toward greener energy solutions, essential for improving sustainability metrics and driving environmental improvements.
Italy has made exemplary progress with significant reductions in its energy consumption across both hotel and housing sectors, which have seen year-on-year decreases of 9.4% and 7.4%, respectively. According to Deepki’s analysis, these reductions may have been achieved due to proactive policies and significant investment in renovations focused on improving energy efficiency. However, these factors should be considered over a matter of years. However, like Germany, Italy will need to make improvements in the logistics sector with high CO₂ emissions, averaging 27 kgCO₂ eq/m2.
Spain stands out for its low energy consumption across various property types, including a 9% reduction in the logistics and healthcare sectors. Effective policy implementation and a strong emphasis on renewable energy adoption have resulted in consistently low CO₂ emissions. This helps position Spain as a model for other EU nations in pursuing greener real estate practices.
The ESG Index as a strategic compass for decision-makers
How can Europe’s real estate drive the net-zero transition? The ESG Index serves as a compass for real estate professionals. By comparing performance indicators across countries, regions, and typologies, decision-makers can effectively identify underperforming assets and prioritize investments.
Beyond supporting investment strategies, the ESG Index has been designed to align with key European regulatory frameworks, such as the EU Taxonomy. To further support the transition, the ESG Index delivers annual performance benchmarks, offering values for the market average, as well as the top-performing 15% and 30% of building stock. These insights, expressed in final energy consumption (kWhFE/m²) and carbon emissions (kgCO₂eq/m²), help stakeholders identify assets that contribute most effectively to climate change mitigation under the EU Taxonomy framework.
Leverage the 2024 ESG Index results
Visit the ESG Index website to easily access a wide range of indicators that cater to your specific needs. Whether you’re looking for primary energy data for taxonomic reporting or other key metrics, everything you need is right at your fingertips. The website offers a clear breakdown of results by region—Europe-wide and for countries like the UK, France, Italy, Benelux, Germany, and Spain. You can explore data across various property types, including logistics, offices, hotels, and retail. Additionally, detailed information on the methodology developed by Deepki is available, providing valuable insights into how the Index was built and the data behind it.

WEBINAR REPLAY
Take action! Catch Deepki Platform’s latest update in action
In Deepki’s latest product release, we share releases designed to simplify compliance with major disclosure standards, including CSRD and IFRS/SASB. We also explore key insights from the latest ESG Index publication and show how to leverage it for informed decision-making.